
The painting Wanderer above a Sea of Fog by German Romantic artist Caspar David Friedrich is often used to depict uncertainty or a dilemma for a wanderer charting unknown territory. The tale of the painting is that the wanderer climbs one peak only to arrive at countless more peaks and the reality sets in that his journey is an ongoing one which will require further chartering, commitment and adjustments.
I often view this as an apt interpretation for defining a startups target market. Market sizing is of the most critical tasks to get right for your new startup but in practice is prone to poor execution. As a leader responsible for a new product launch it’s a high-stakes challenge to get wrong as it sets the investment case for your company/team, how large the problem space is and the tone of how you plan to tackle your go-to-market.
Your go-to-market approach is informed by what you understand your total addressable market to be so it’s important to build an accurate view of its potential early on, otherwise, you will be left with a suboptimal apparatus to capture the market value. Many early-stage investors will sit at a distance and tell you ‘we don’t care how big your TAM is we back product founders and great teams’ but I can tell you that in practice teams that have not gone through the process of TAM identification are teams that have high likelihood of failure and are slow to build the muscle of intelligent resource allocation at the critical Series A juncture; later ending up with under-resourced teams and retro-fitted markets which the product was not designed for.
It’s also important to identify the anti-goal of a TAM; it isn’t a prescribed map you are wedded to; think of it more as a rudder for how the business and product direction may evolve over time.
In early-stage companies, I have seen TAM identification to be a common trait of breakout companies whilst also creating a safety-net to pivot towards new segments where required. As an operator, I’ve designed market sizing and go-to-market approaches at several early and late-stage companies. In 2014 I was responsible for launching Twitter’s mobile app product suite and business unit in EMEA and in 2017 launched Stripe’s startup partnership strategy; here are some of the principles I used to guide TAM.
What is TAM?
Total addressable market represents the revenue potential for a product assuming a business has unlimited resources and all eligible customers in a target market are acquired. Typically TAM is built as a function of revenue potential to primarily assess:
* How many customers are in your segments and what is the £ value?
* What size (customers and value) are your priority geographies and how do you assess market readiness?
* Does the revenue potential warrant a test investment or fully loaded investment?
TAM can also be engineered to provide additional insights to various teams from product to sales and in practice is the one single metric I’ve observed teams rally behind which can facilitate:
* Future product roadmap and adjacent product lines in TAM
* Method for measuring product-market fit to assess market share over time
* Size of problem space for prospective investors and employees
* Identifies competitors and friendlies in adjacent markets
The challenge with an accurate TAM is that future markets will look nothing like today’s; the game has changed. Startups are iterating through multiple technology cycles whilst markets are coalescing so being aware of TAM and adjacent growth opportunities will enable a smart startup to identify near-term growth and grey-areas between markets which they may enter overtime.
It’s easy to get TAM incorrect and it has broad ramifications for how the market views your business; the perfect example of this is Uber. Back in 2014, Benchmark investor Bill Gurley and NYU professor Aswath Damodaran clashed over Damodaran’s low estimate of Uber’s valuation in a New York Times article. The issue was that Uber initially set their stall out to win the taxi and limousine market and not the multiple markets it operates in today. Gurley’s perspective was that the future of transportation will be nothing like the past and Uber was well placed to capture this moving market - according to Gurley "in choosing to use the historical size of the taxi and limousine market, Damodaran is making an implicit assumption that the future will look quite like the past".
The Uber challenge is indicative of the issue many startups grapple with; Uber likely had some understanding of markets they could tackle in the future but needed to first win a small beach-head market in order to solidify their position. Gurley’s investment thesis has since proven true with Uber operating multiple product-lines from self-driving cars, public transportation, data and food delivery globally but the point remains moot; how exactly should a startup articulate their long-term TAM?
1. Fine-tune TAM to identify your true audience and revenue potential
The actionable level of detail for TAM in go-to-market strategy lies in narrowing the scope of TAM to tangible sub-segments namely serviceable available market (SAM) and serviceable obtainable market (SOM).
SAM and SOM should be defined as early as possible in your go-to-market as the likelihood of a startup reaching 100% of its TAM is negligible thus SAM and SOM are optimized to get the business to a point where dominance in a vertical or beach-head segment is possible. Serviceable available market focuses on the part of your TAM that is being directly served by your product where your product momentum points towards the highest propensity for product-market fit whereas serviceable obtainable market focuses on what share of your SAM can be captured given your current product suite and trajectory.
If you are a startup with a point solution there is no value in competing with a full-stack market leader in a segment they are fully dominant in, your upside is limited. Picture Superhuman taking aim at the entire email market instead of the thin sliver of tech-forward early adopters that have driven the product’s initial success.

Notwithstanding, the most common misapplication of TAM is where a startup builds its go-to-market motion as though their TAM were a prospect list. This will result in many false negatives and false positives for product-market fit which can send the business spinning its wheels in the wrong product-direction. The below graph visualizes the available TAM for a hypothetical saas messaging company in Europe named Stack with a high-touch offering for enterprise and mid-market companies and self-serve offering for SMBs. For Stack, SMB has the largest TAM available but they know market urgency and readiness is not evident in that segment so the identification of SOM at mid-market and enterprise-level becomes crucially important.
The issue with an unoptimized TAM for Stack is that it focuses on how large the market is and gives the business little insight on how to enter the market and what market share is attainable. In this scenario Stack is working to what I term ‘Chinese glove syndrome’ (selling a single glove to every person in China) where they know that the probability of success with this strategy is low. What a lot of companies get wrong is that their initial TAM is merely a jumping-off point to understand how big the market is and subsequently identify the best approach to carving up the market aligned with their product offering and best-fit customers.
For Stack to be successful a segmented TAM is required to narrow the funnel towards a defined list of potential customers with the highest probability of acquisition. For simplicity purposes, I’ve taken Europe as the geography with a standard segmentation framework of enterprise, mid-market and smb. As you build on your TAM segmentation it is best practice to augment your TAM with additional data-points to arrive at the true representation of your target market. Typical data-points to bring into your TAM identification process are:
* % addressability and the expected change in addressability over a 5 year time horizon
* Force-ranked market readiness for weighted market entry launch schedule
* Vertical data from sources like Eurostat, Pitchbook, Crunchbase, ALF, Mixed Panel
* Total market size by segment, customers and revenue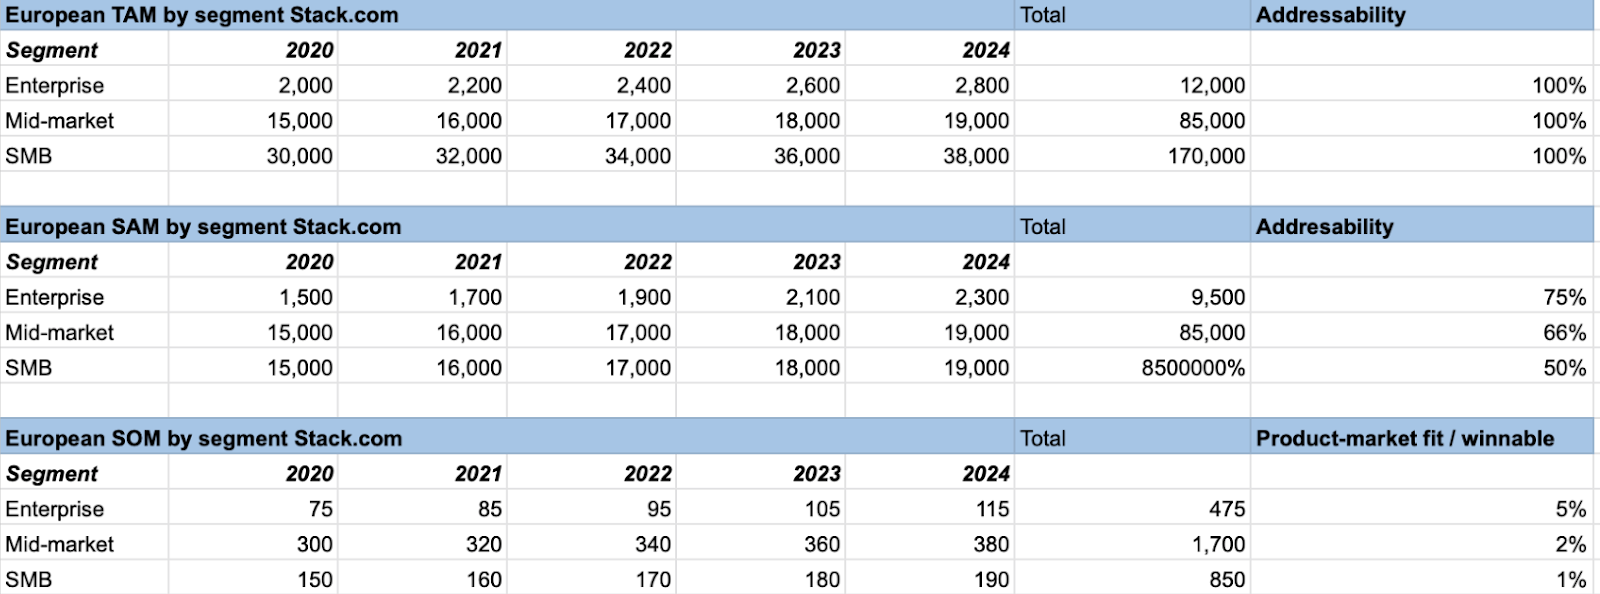
Having calibrated the market against these parameters serviceable obtainable market informs Stack that mid-market is the largest customer segment followed closely by SMB and lastly enterprise but there is little insight on the readiness and addressability of these segments to use Stack’s solution. SAM and SOM can be implemented as a forcing function to build a more robust view on addressability and readiness so the latent demand that exists for your product in a market becomes known; this is achieved primarily through a bottom-up analysis.
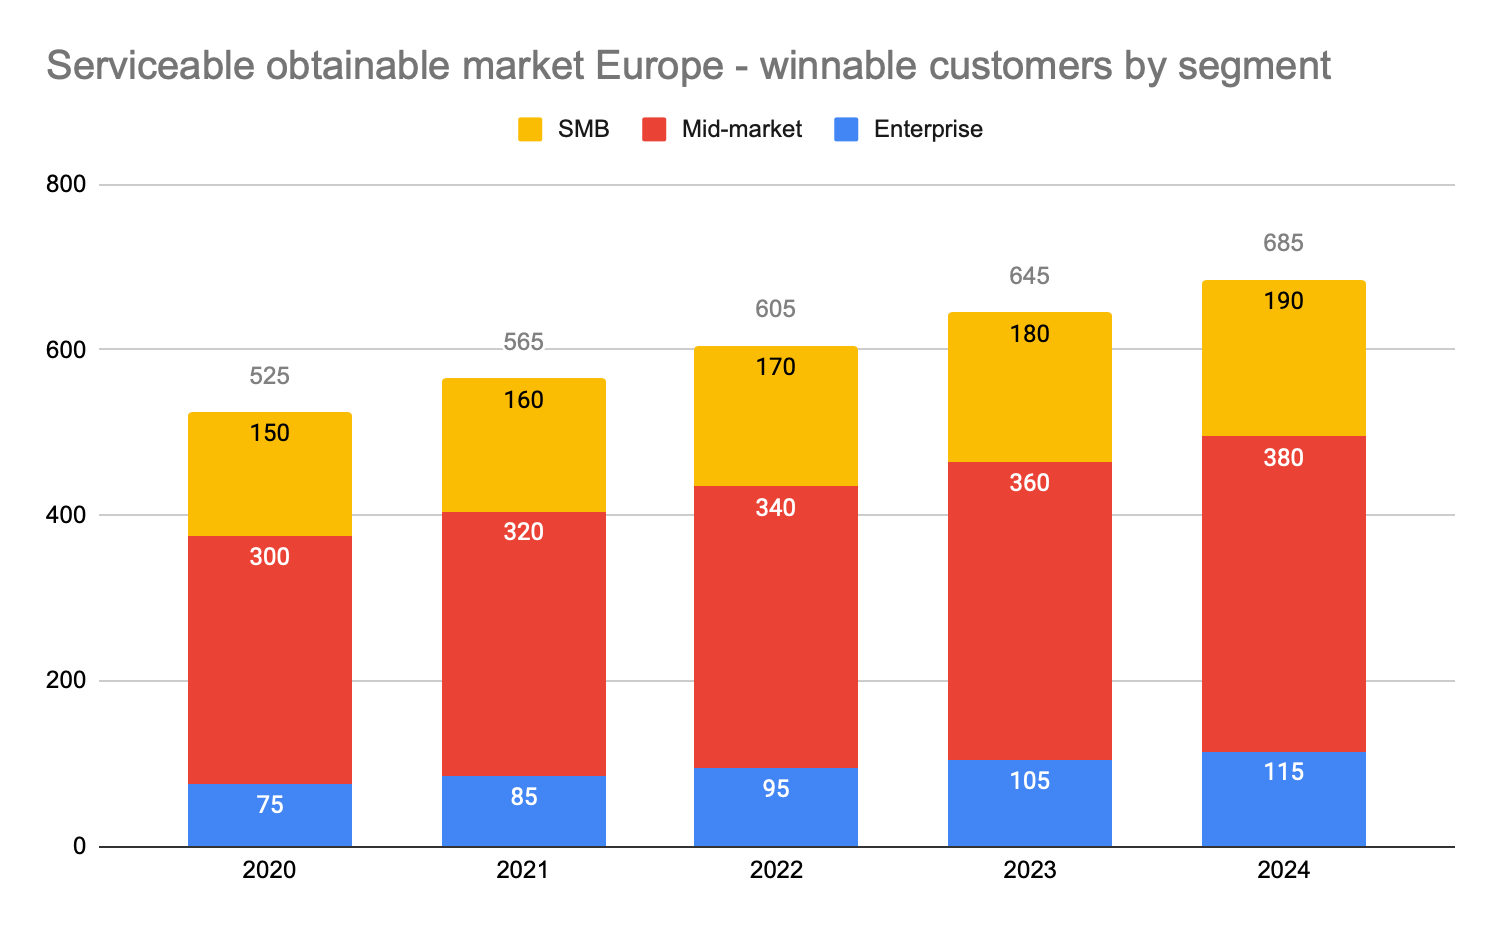
Zooming out and analyzing SOM further over a 5 year time horizon it's also possible to see that it is a growing market even at a restricted local maximum assuming no incremental growth in product-market fit. In further modelling, you can also make assumptions on how your product-market fit will evolve over-time and the incremental customer base this will offer you.
2. A bottom-up analysis gives you revenue predictability
Your TAM should have day to day utility in the business. Failure-mode for building a TAM without day to day utility is adopting a top-down analysis selecting a £ market value from a Gartner or IDC report assuming you can capture even a small share like 0.5% or 1%. Using this method keeps you at a detrimental distance from factors like addressability, product-market fit, segmentation and pricing which will come back to haunt you once you start making upfront investment decisions like how many sales reps to hire.
At Series A stage how will you justify making senior sales leadership hires if you cannot verify your path to revenue? This top-down approach is also prone to SOM over-estimation as the atomic-level components of your market size and barriers to increasing market share have not been explored amongst the founding team.
Teams that understand TAM risks and opportunities always bias towards a bottom-up methodology. The formula I use to assess a bottom-up TAM is :
* Total target customers X segment = total addressable customers X revenue per segment = TAM*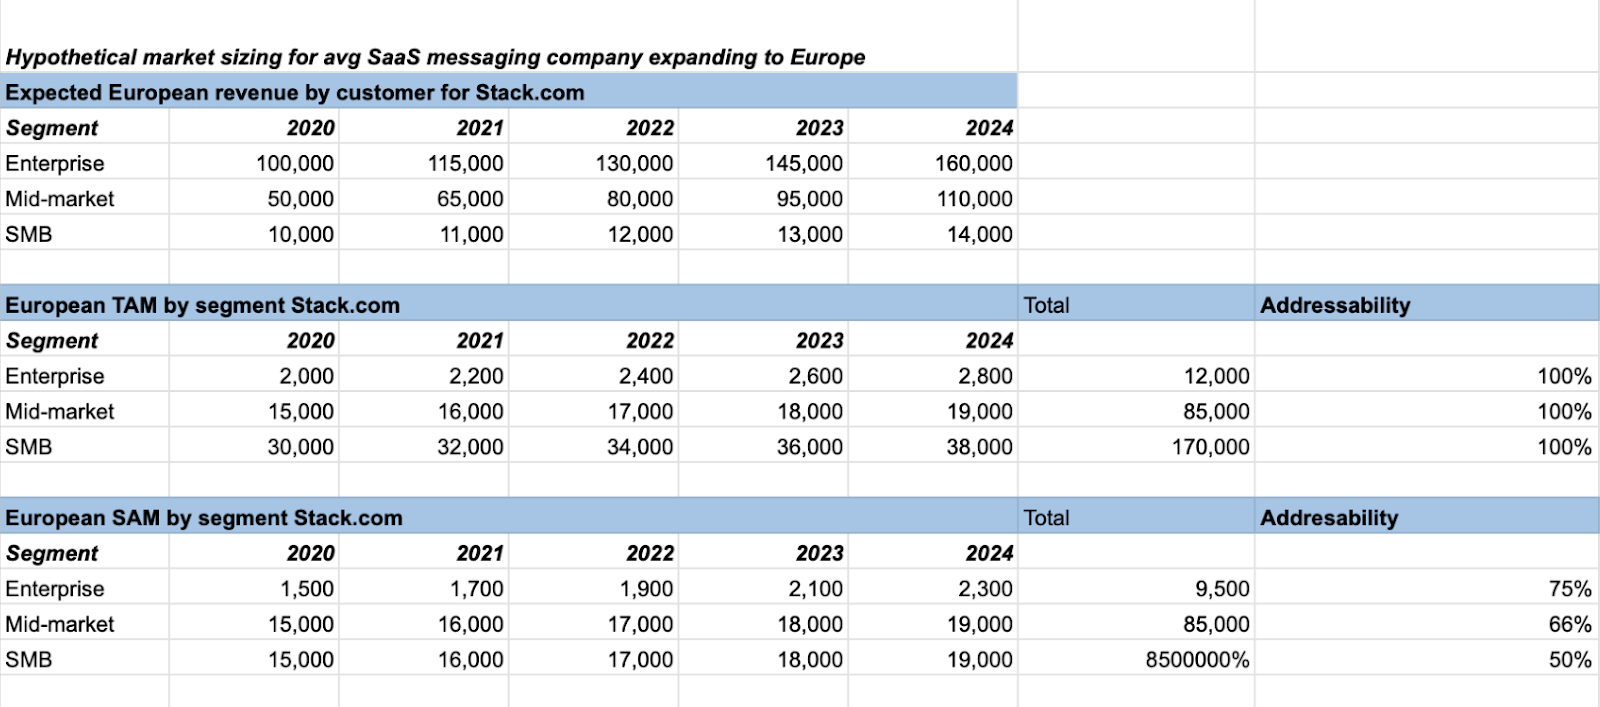
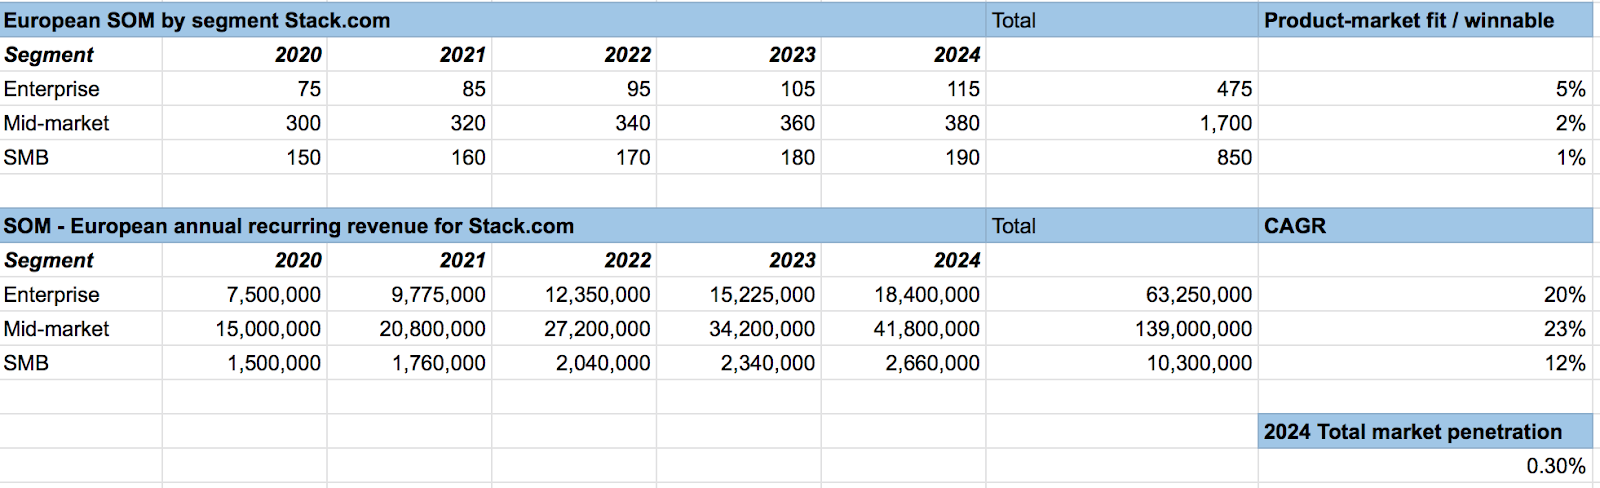
In the example of Stack it’s possible to move down the funnel to identify a SAM with forecasted revenue and addressability by segment before backing into SOM and the best-fit customers for acquisition. You can see that mid-market and enterprise are the largest segments with most revenue whilst SMB contributes a negligible percentage of overall revenue even in year 5. Whilst some segments like SMB may look attractive on paper this is strong signal for Stack to reconsider their product offering away from self-serve to focus only on mid-market and enterprise verticals in Europe and scrap the focus on SMB which has low revenue potential and high maintenance costs.
A good bottom-up analysis will also include a market share metric defined by a set of common signals that may be segment, revenue or customer profile specific. As in the case of Stack this is a multi-segment level where Stack can see forecasted total market penetration in 2024 is .3% of TAM missing their initial target of 1% by over 3x.
This is critical as it means Stack now have sufficient unit-level insights to revisit their TAM and adjust pricing, product or customer levers to arrive at their 1% target instead of a finger in the air top-down approach which results in mistakes and leaves many founders without a route forward for winning a market. As you start to budget revenue for upfront hiring decisions your TAM should be your north star countered closely by near-term growth prospects of SOM.
3. Your customer’s buying cycle will create speed bumps
Stack now has a clear path forward to winning key customers across mid-market and enterprise segments. All that is remaining is to actually sell the product to customers so it should be plain sailing from here, right? - wrong! Lets recap on what we’ve learned about Stack.
**Critical mass-market size**
* Year 1 TAM of 47k customers growing to 60k over a 5 year period
**High addressability**
* Year 1 SAM of 31,500 customers growing to 41,000 over a 5 year period
* Year 1 SOM of £24M and growing to Y over a 5 year period
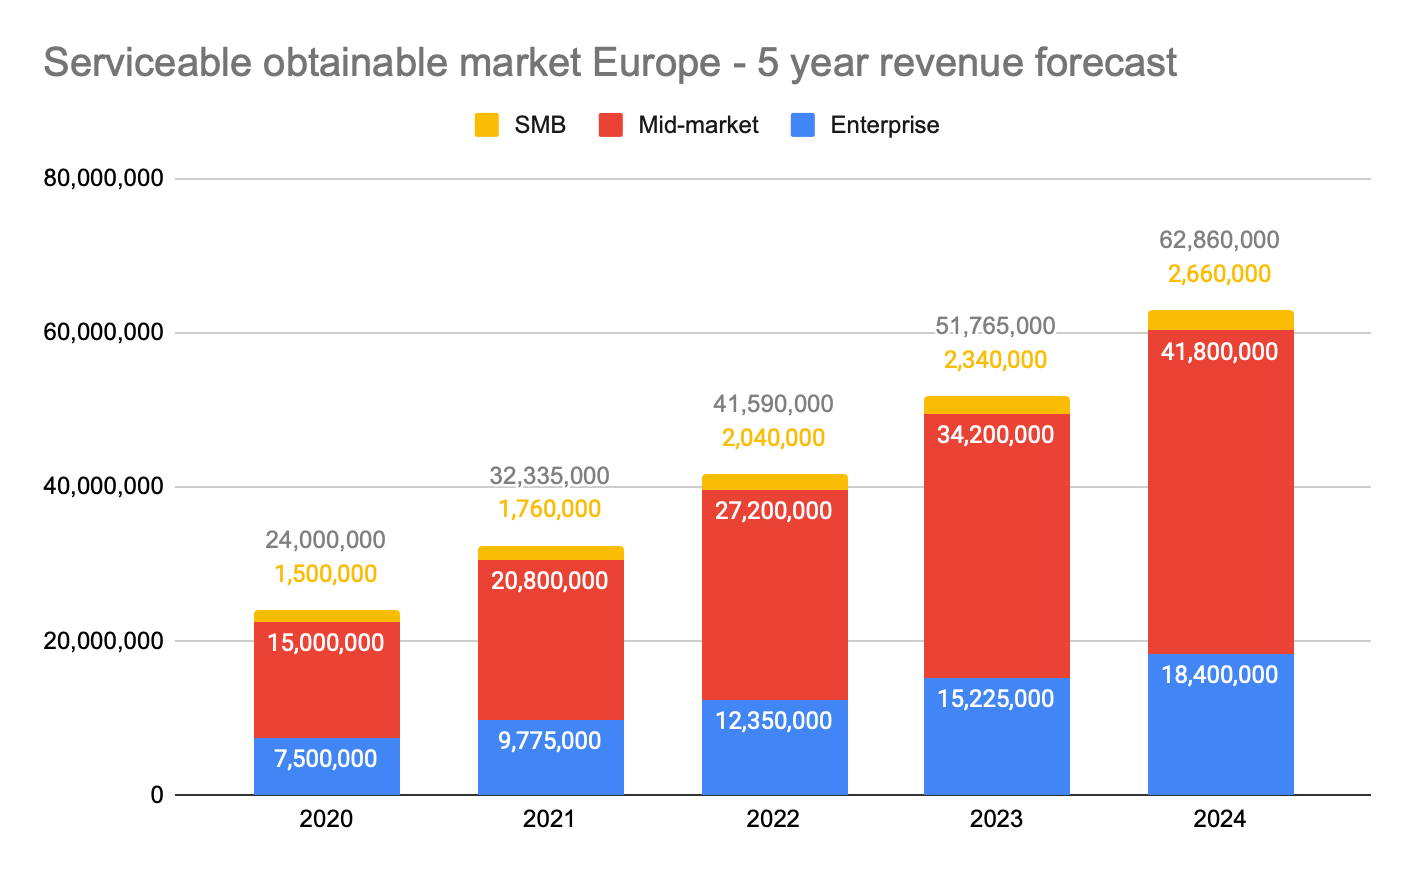
**Mid-market led growth**
* Year 1 SOM of £24M composed mostly of mid-market (15M) growing to £63M over a 5 year period with highest CAGRLet's assume Stack achieves even 25% of their SOM in year 1; that's an incremental £6M in ARR from Europe. As you enter the market your team starts to get a grip on Stack’s average sales cycle and you see that mid-market and enterprise sales cycles are 6 and 12 months respectively. You also learn that:
- 70% of your target SOM are on discounted full-stack productivity software solutions from a market leader with no plans to change in next 24 months
- 10% of deals require multi-constituent sign-off via CIO, CFO and COO and have been delayed due to lack of a CxO selling strategy at Stack
- 5% of deals are in the low-end of mid-market with unrealistic pricing expectations from this customer sub-segment
- 5% of deals need to give a 6 month notice period to their current provider the market leader
In combination, this means the startup hits only 10% of their SOM generating 2.4M and putting the business in a disadvantageous position with a large deficit moving into year 2 of their 5-year plan. This can happen as it is easy to disregard the nuances for how your customer buys in an industry when building your plan so be critical in identifying and building in contingency reflective of the customer buying cycle. Often times year 1 will be an experimentation year to build a view on avg sales cycle, avg deal size, optimal pricing and the most appropriate sales motion to win deals in your target segment. Year 2 will typically experience triple-digit growth due to the heavy lifting and direct sales engagement in year 1 creating halo effects in the following year. In this respect your SOM is only as good as the market data you are generating; ensure you give you and your founding team optionality in year 1 to experiment with revenue generation and create a live feedback loop as you receive signal from the market on how to best sell and win over the long-term.
In summary as you build your TAM treat it as a process of finding that elusive customer sweet spot with the goal of pressure testing product-market fit with targeted sub-segments which you can expand on and develop deep expertise in. As you think about product-market fit for your startup bear 4 key factors in mind which will help guide you towards a built for purpose TAM that can guide your thinking:
- Avoid Chinese Glove Syndrome - nobody wants to buy a single glove! Particularly not the 1.4 billion people in China.
- Optimize for serviceable obtainable market to realise the latent demand for your product.
- The future is not in the past. Today’s markets do not indicate future potential.
- Know your customer buying cycle without contingency accounted for it may slow you down.
The key learning with TAM is that market data cannot be the sole arbiter of how you articulate the size of the prize. It is a balancing act where there is a lot of market inertia for a startup to manage and be accountable to. The key is in progressive movement over a multi-year time horizon and beach-head wins in year 1 to ensure a solid foundation which you can expand on.
